Metascape Gene List Analysis Report
metascape.org1
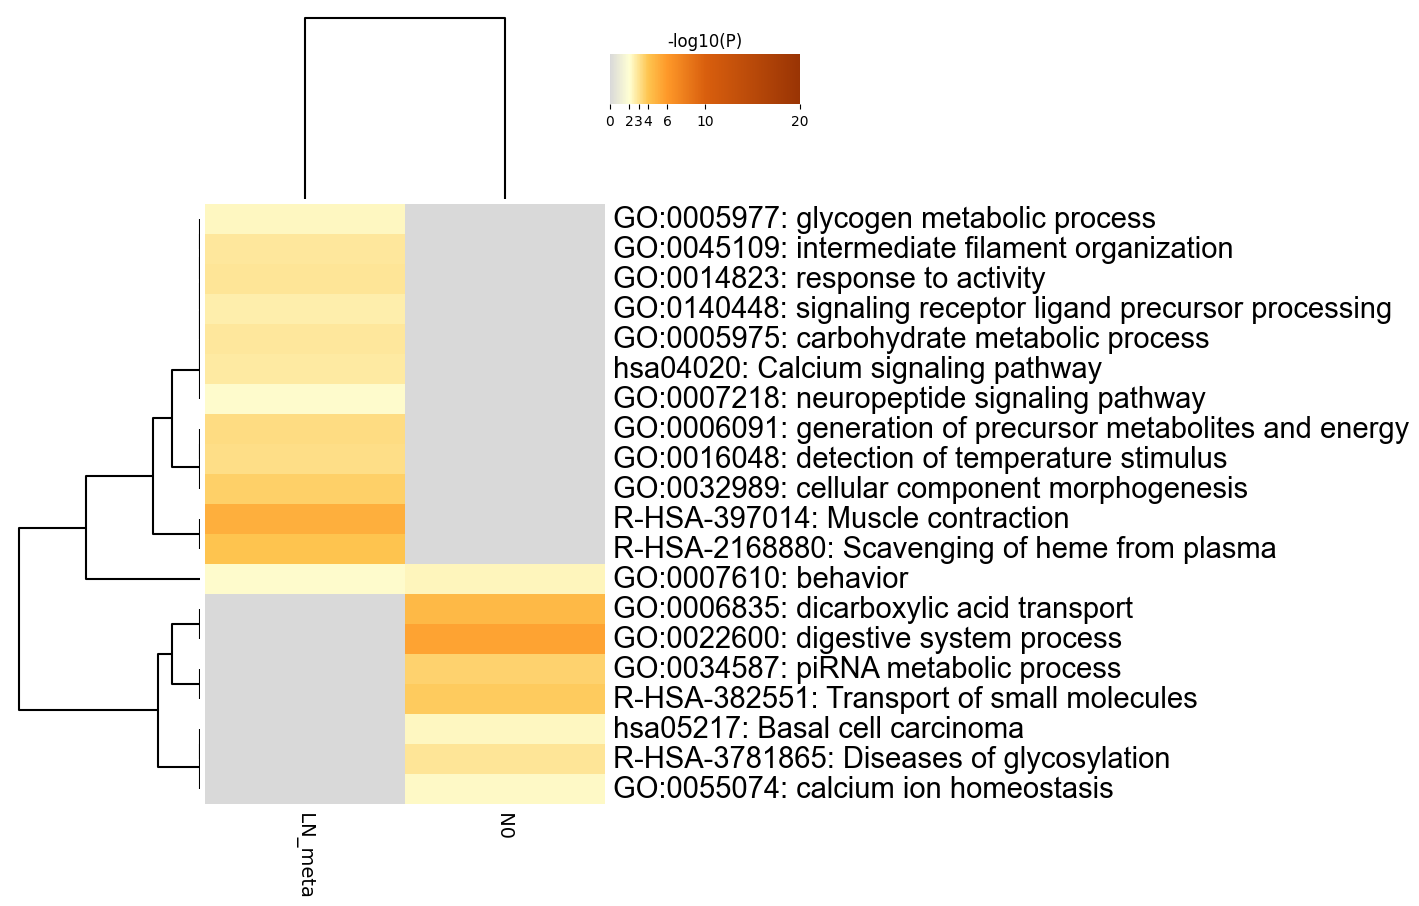
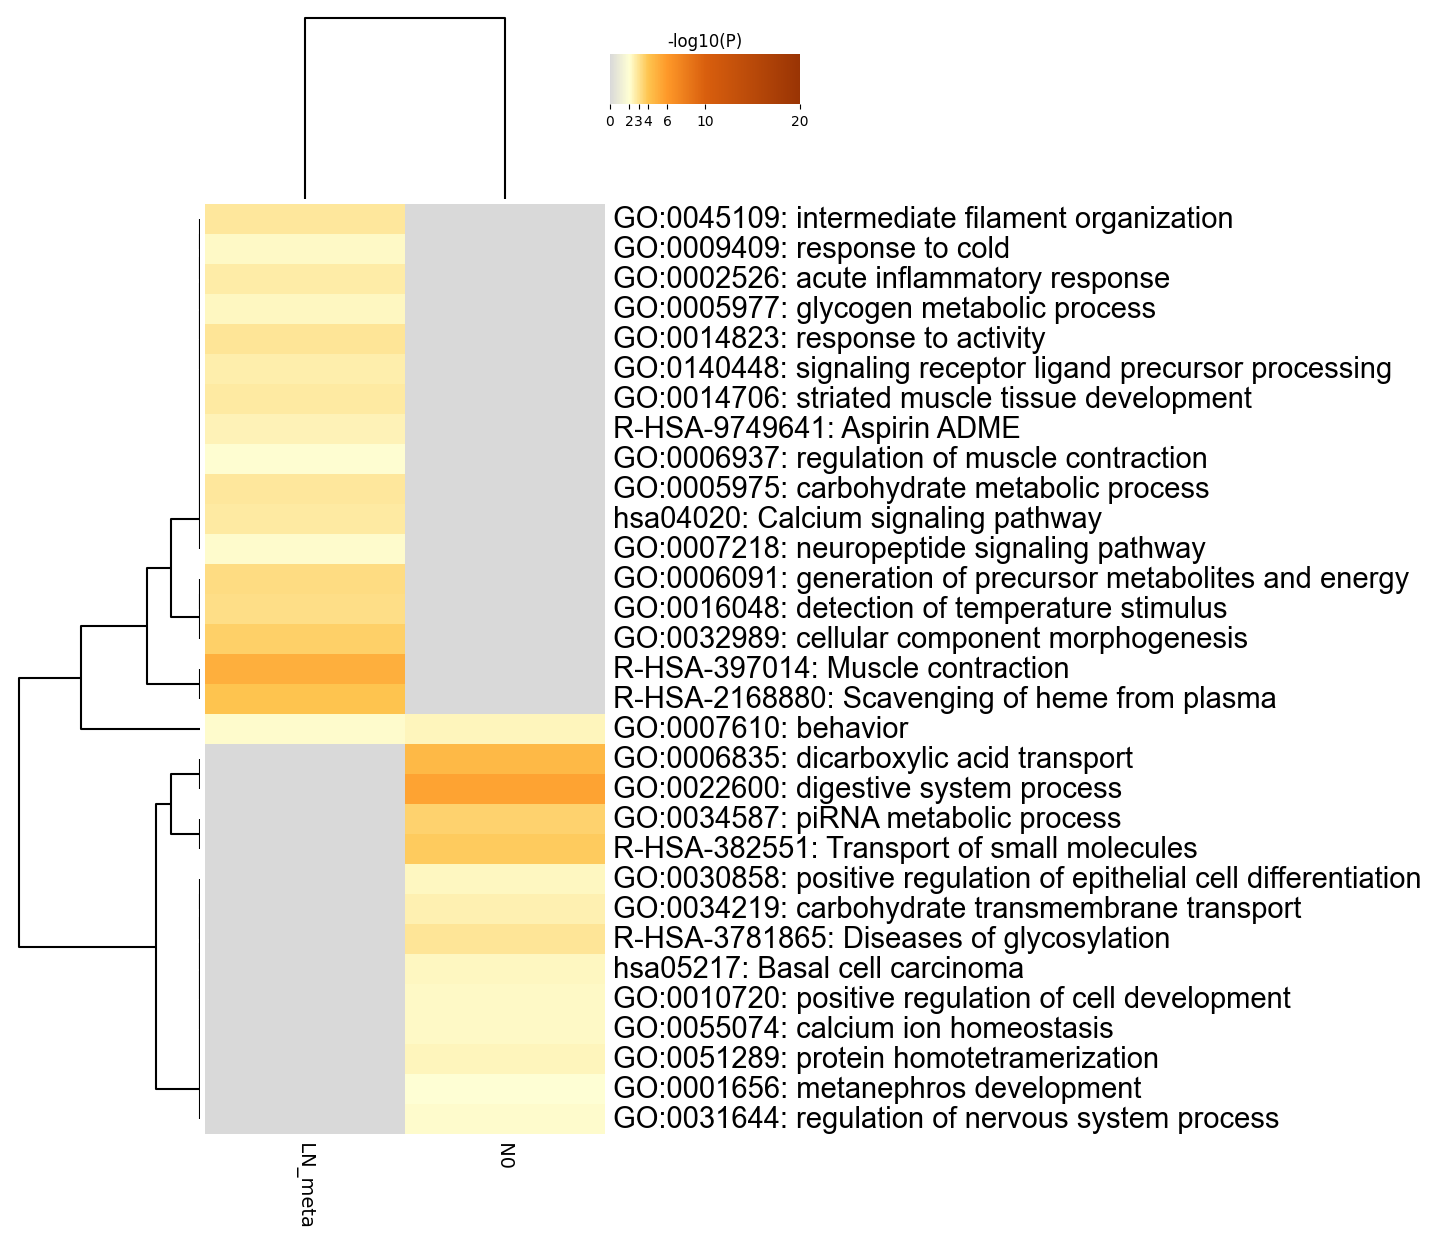
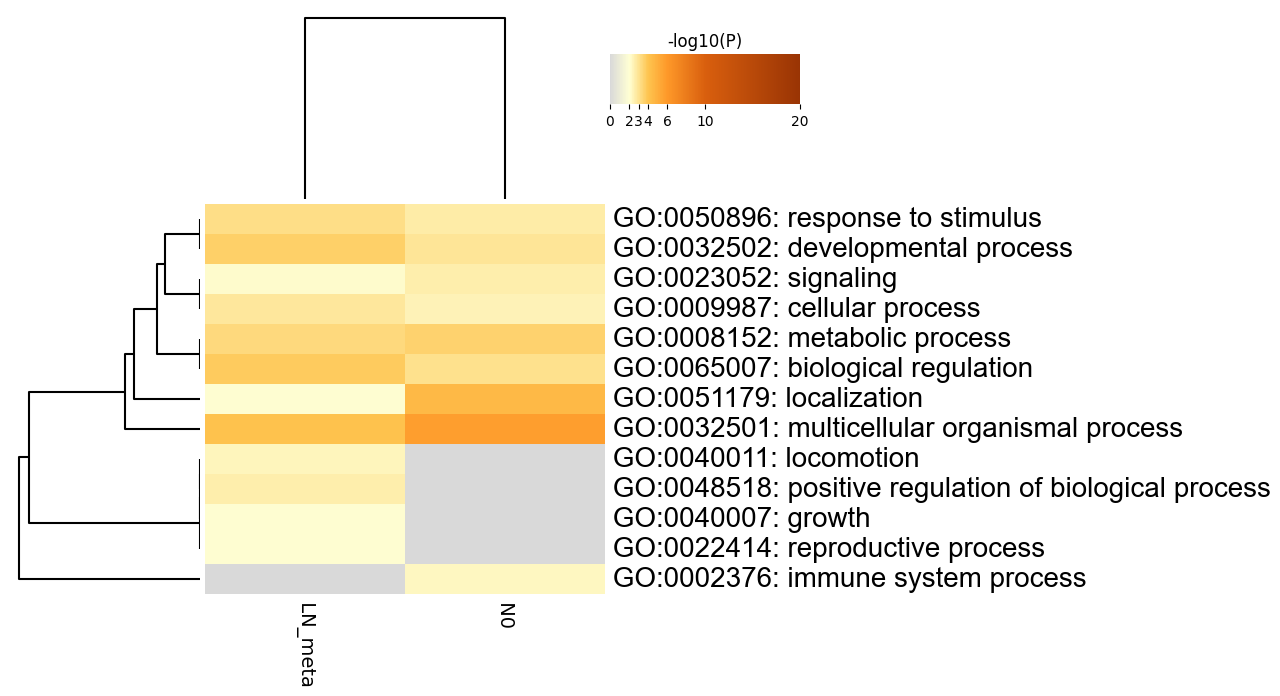
Heatmap Summary
The heatmap can be interactively viewed using
JTreeView2 (.cdt, .gtr and .atr files can be found in the Zip package).
Gene Lists
User-provided gene identifiers are first converted into their corresponding H. sapiens Entrez gene IDs using the latest version of the database (last updated on 2022-04-22). If multiple identifiers correspond to the same Entrez gene ID, they will be considered as a single Entrez gene ID in downstream analyses. Each gene list is assigned a unique color, which is used throughout the analysis. The gene lists are summarized in Table 1.
Table 1. Statistics of input gene lists.
| Name |
Total |
Unique |
Color Code |
| LN_meta |
260 |
225 |
|
| N0 |
193 |
171 |
|
Pathway and Process Enrichment Analysis
For each given gene list, pathway and process enrichment analysis has been carried out with the following ontology sources: GO Biological Processes, KEGG Pathway and Reactome Gene Sets. All genes in the genome have been used as the enrichment background. Terms with a p-value < 0.01, a minimum count of 3, and an enrichment factor > 1.5 (the enrichment factor is the ratio between the observed counts and the counts expected by chance) are collected and grouped into clusters based on their membership similarities. More specifically, p-values are calculated based on the accumulative hypergeometric distribution
3, and q-values are calculated using the Benjamini-Hochberg procedure to account for multiple testings
4. Kappa scores
5 are used as the similarity metric when performing hierachical clustering on the enriched terms, and sub-trees with a similarity of > 0.3 are considered a cluster. The most statistically significant term within a cluster is chosen to represent the cluster.
When multiple gene lists are provided, all lists are merged into one list called "_FINAL". A term may be found enriched in several individual gene lists and/or in the _FINAL gene list, and the best p-value among them is chosen as the final p-value. The pathway/process clusters that are found to be of interest (either shared or unique based on specific list enrichment) are used to prioritize the genes that fall into those clusters (membership is presented as 1/0 binary columns in the Excel spreadsheet). Note that individual gene lists containing more than 3000 genes are ignored during the enrichment analysis to avoid superficial terms; this is because long gene lists are often not random and generally trigger too many terms that are not of direct relevance to the biology under study.
Table 2. Top 20 clusters with their representative enriched terms (one per cluster). "Count" is the number of genes in the user-provided lists with membership in the given ontology term. "%" is the percentage of all of the user-provided genes that are found in the given ontology term (only input genes with at least one ontology term annotation are included in the calculation). "Log10(P)" is the p-value in log base 10. "Log10(q)" is the multi-test adjusted p-value in log base 10. __PATTERN__ shows the color code used for the gene lists where the term is found statistically significant, i.e., multiple colors indicate a pathway/process that is shared across multiple lists.
| _PATTERN_ |
GO |
Category |
Description |
Count |
% |
Log10(P) |
Log10(q) |
| |
GO:0022600 |
GO Biological Processes |
digestive system process |
6 |
3.97 |
-5.74 |
-2.78 |
| |
R-HSA-397014 |
Reactome Gene Sets |
Muscle contraction |
8 |
16.33 |
-8.99 |
-4.73 |
| |
GO:0006835 |
GO Biological Processes |
dicarboxylic acid transport |
5 |
3.31 |
-4.66 |
-2.15 |
| |
R-HSA-2168880 |
Reactome Gene Sets |
Scavenging of heme from plasma |
3 |
6.12 |
-5.94 |
-2.94 |
| |
GO:0016048 |
GO Biological Processes |
detection of temperature stimulus |
5 |
3.31 |
-6.94 |
-3.34 |
| |
GO:0032989 |
GO Biological Processes |
cellular component morphogenesis |
8 |
16.33 |
-5.43 |
-2.55 |
| |
R-HSA-382551 |
Reactome Gene Sets |
Transport of small molecules |
17 |
11.26 |
-6.79 |
-3.31 |
| |
GO:0006091 |
GO Biological Processes |
generation of precursor metabolites and energy |
11 |
7.28 |
-5.29 |
-2.48 |
| |
GO:0034587 |
GO Biological Processes |
piRNA metabolic process |
4 |
2.65 |
-5.23 |
-2.45 |
| |
GO:0140448 |
GO Biological Processes |
signaling receptor ligand precursor processing |
4 |
8.16 |
-6.41 |
-3.26 |
| |
R-HSA-3781865 |
Reactome Gene Sets |
Diseases of glycosylation |
5 |
3.31 |
-3.11 |
-1.07 |
| |
GO:0005977 |
GO Biological Processes |
glycogen metabolic process |
3 |
1.99 |
-2.75 |
-0.79 |
| |
hsa05217 |
KEGG Pathway |
Basal cell carcinoma |
5 |
3.31 |
-4.79 |
-2.23 |
| |
GO:0014823 |
GO Biological Processes |
response to activity |
3 |
6.12 |
-3.77 |
-1.56 |
| |
GO:0055074 |
GO Biological Processes |
calcium ion homeostasis |
7 |
4.64 |
-4.05 |
-1.75 |
| |
GO:0045109 |
GO Biological Processes |
intermediate filament organization |
5 |
10.20 |
-7.06 |
-3.34 |
| |
GO:0007610 |
GO Biological Processes |
behavior |
12 |
7.95 |
-4.48 |
-2.04 |
| |
GO:0005975 |
GO Biological Processes |
carbohydrate metabolic process |
11 |
7.28 |
-4.72 |
-2.19 |
| |
GO:0007218 |
GO Biological Processes |
neuropeptide signaling pathway |
5 |
10.20 |
-6.03 |
-3.00 |
| |
hsa04020 |
KEGG Pathway |
Calcium signaling pathway |
10 |
6.62 |
-6.41 |
-3.26 |
To further capture the relationships between the terms, a subset of enriched terms have been selected and rendered as a network plot, where terms with a similarity > 0.3 are connected by edges. We select the terms with the best p-values from each of the 20 clusters, with the constraint that there are no more than 15 terms per cluster and no more than 250 terms in total. The network is visualized using
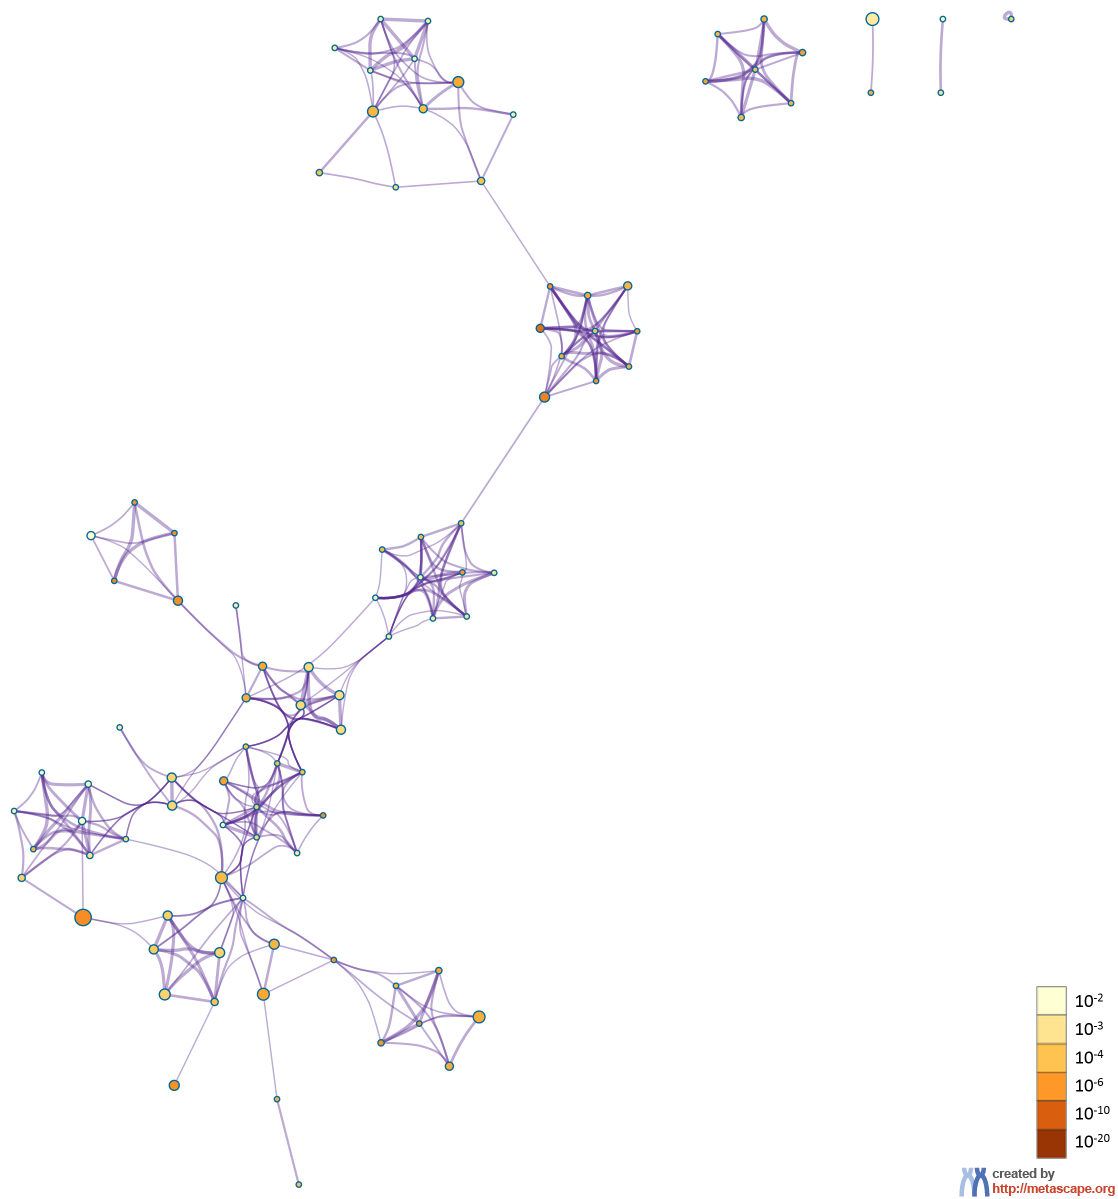
Cytoscape6, where each node represents an enriched term and is colored first by its cluster ID (Figure 2.a) and then by its p-value (Figure 2.b). These networks can be interactively viewed in Cytoscape through the .cys files (contained in the Zip package, which also contains a publication-quality version as a PDF) or within a browser by clicking on the web icon. For clarity, term labels are only shown for one term per cluster, so it is recommended to use Cytoscape or a browser to visualize the network in order to inspect all node labels. We can also export the network into a PDF file within Cytoscape, and then edit the labels using Adobe Illustrator for publication purposes. To switch off all labels, delete the "Label" mapping under the "Style" tab within Cytoscape, and then export the network view.
Figure 2. Network of enriched terms: (a) colored by cluster ID, where nodes that share the same cluster ID are typically close to each other; (b) colored by p-value, where terms containing more genes tend to have a more significant p-value.
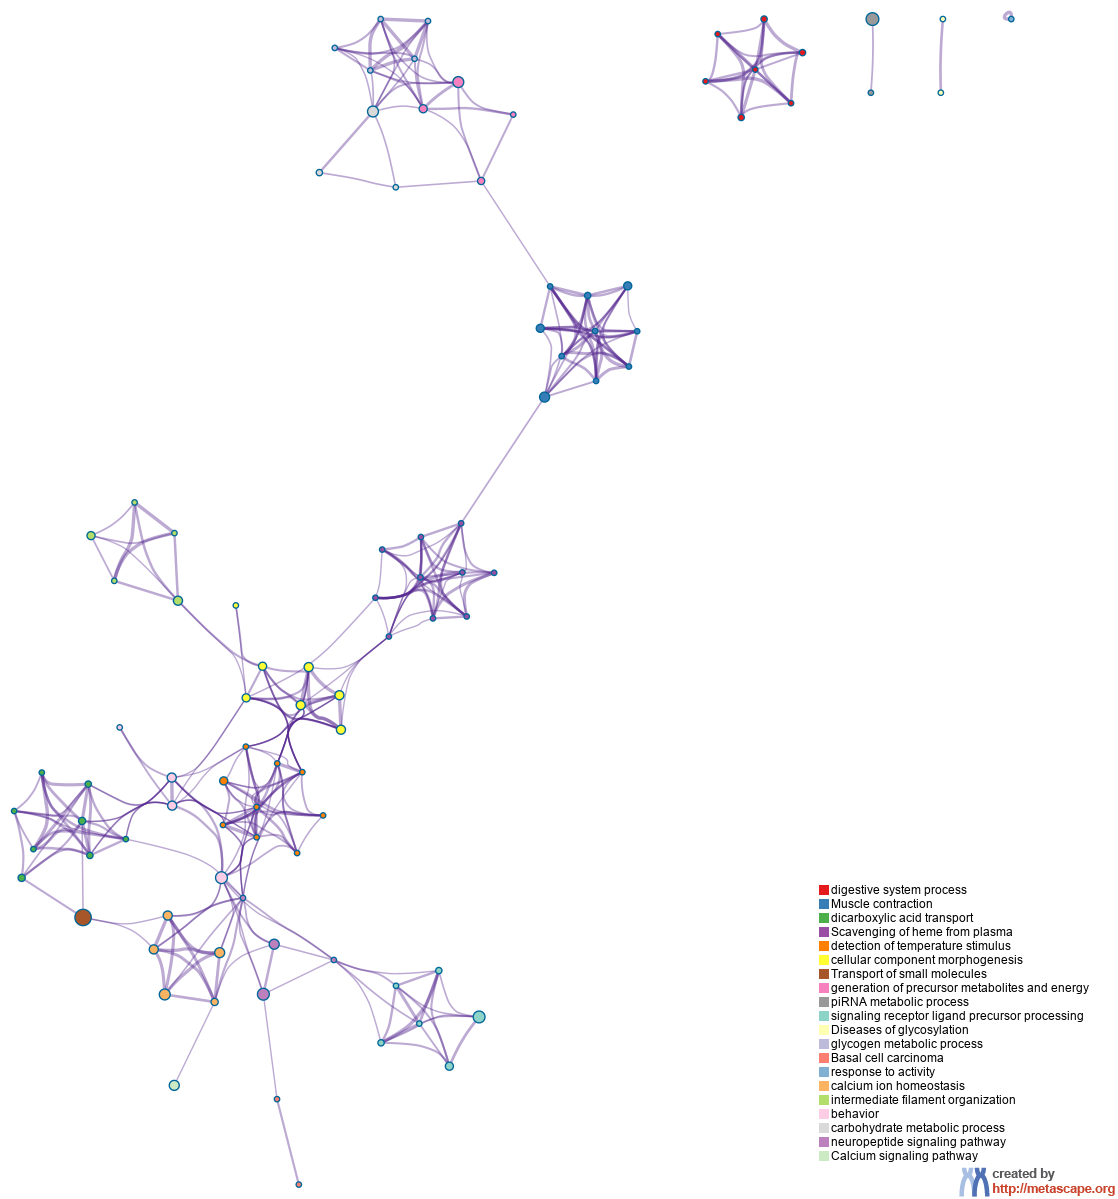
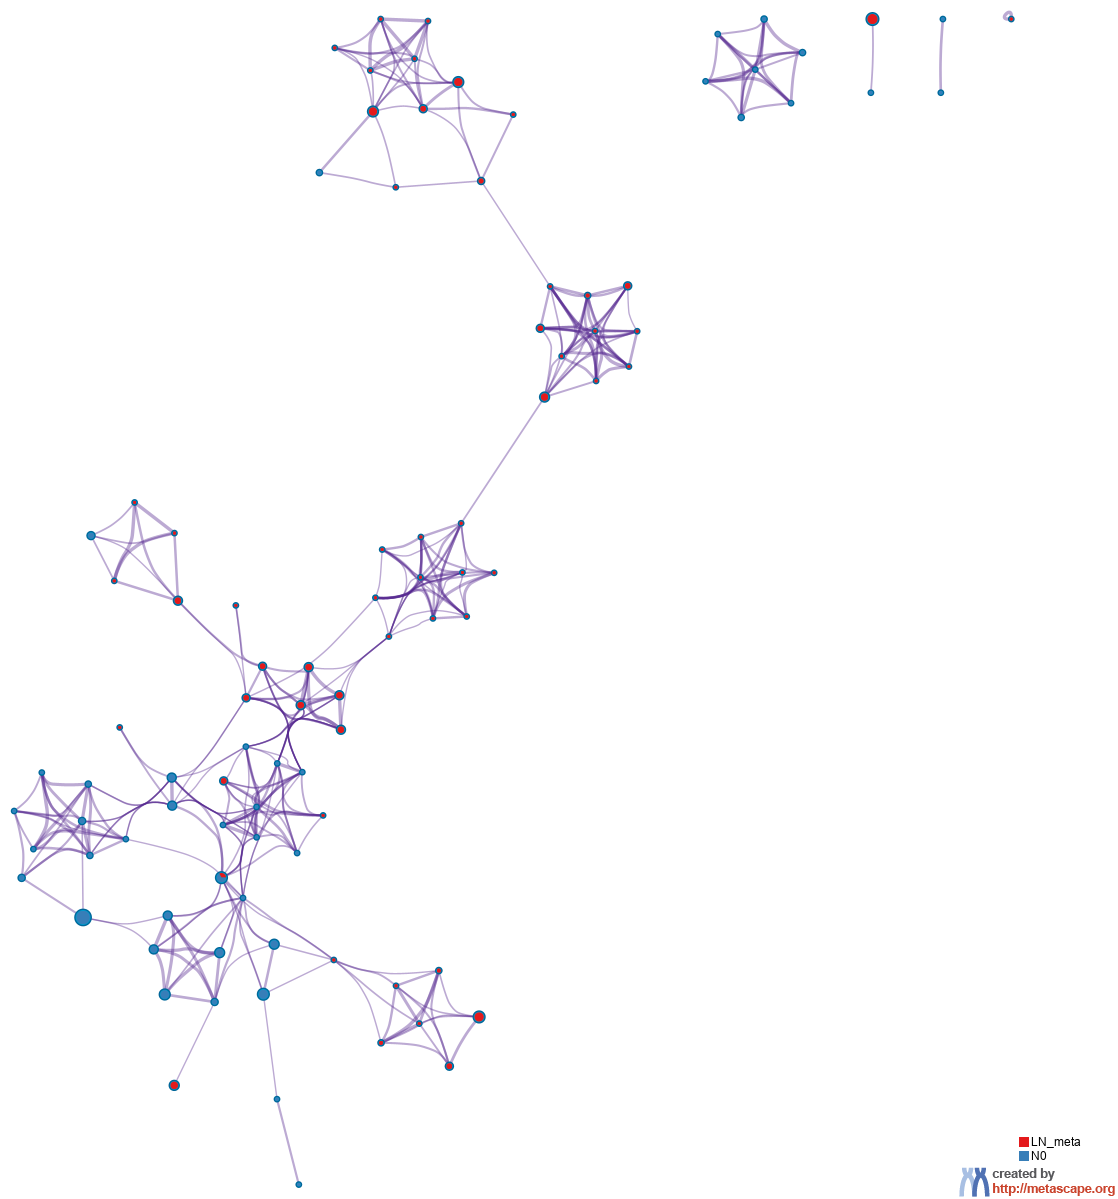
In the case of when multiple gene lists are provided, the nodes are represented as pie charts, where the size of a pie is proportional to the total number of hits that fall into that specific term. The pie charts are color-coded based on the gene list identities, where the size of a slice represents the percentage of genes under the term that originated from the corresponding gene list. This plot is particularly useful for visualizing whether the terms are shared by multiple lists or unique to a specific list, as well as for understanding how these terms associate with each other within the biological context of the meta study (Figure 3).
Figure 3. Network of enriched terms represented as pie charts, where pies are color-coded based on the identities of the gene lists.
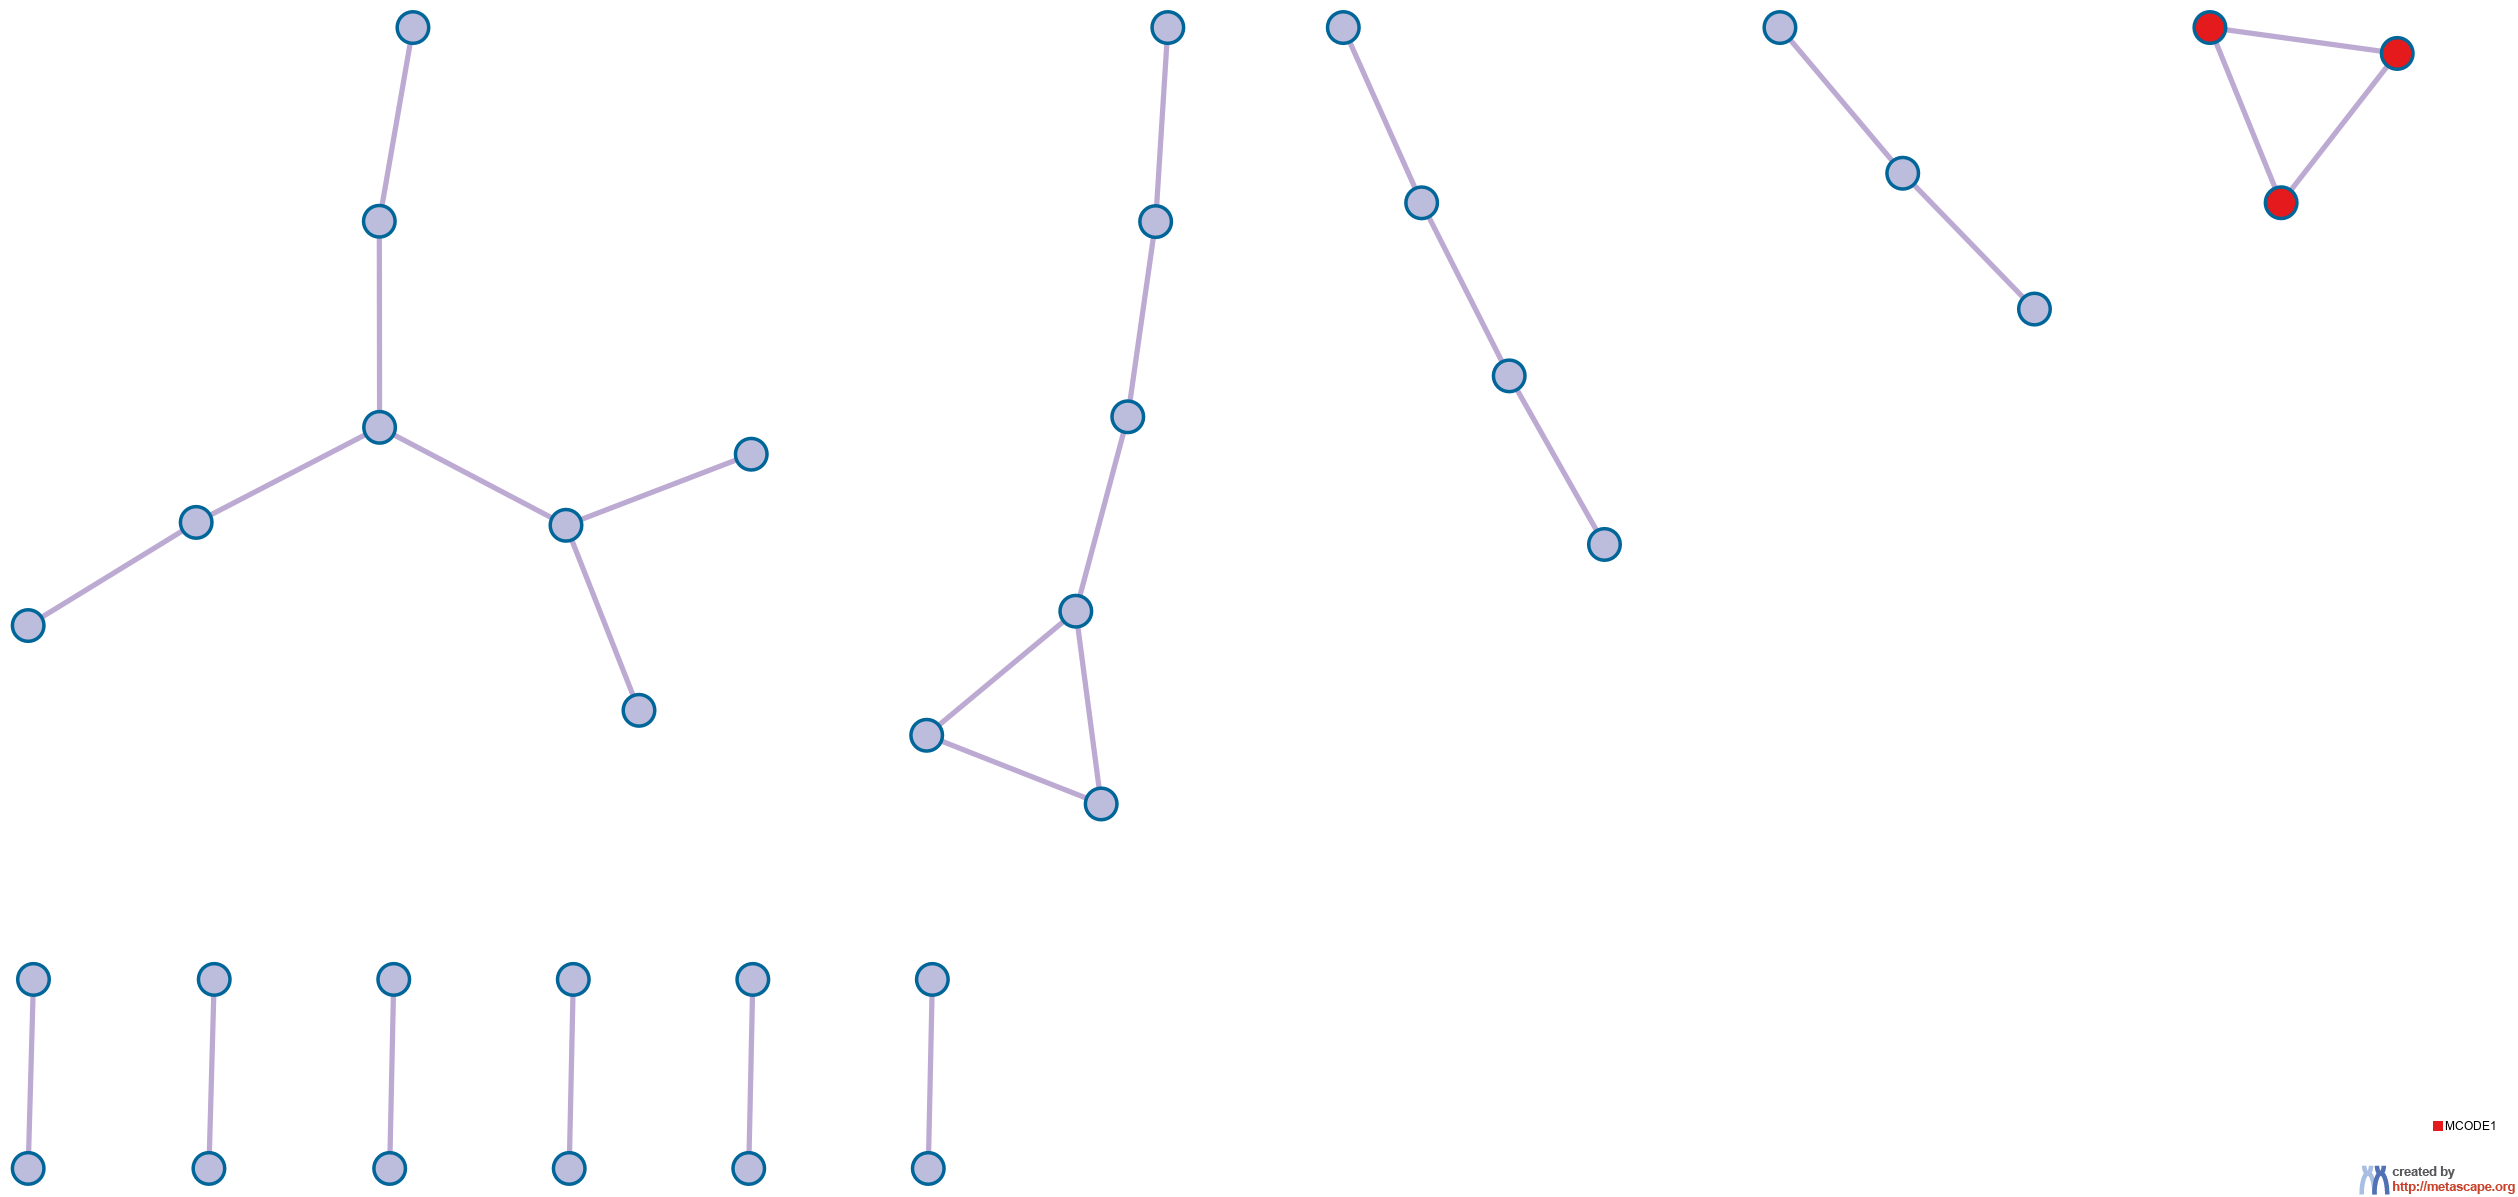
Protein-protein Interaction Enrichment Analysis
For each given gene list, protein-protein interaction enrichment analysis has been carried out with the following databases: STRING
7, BioGrid
8, OmniPath
9, InWeb_IM
10.Only physical interactions in STRING (physical score > 0.132) and BioGrid are used (
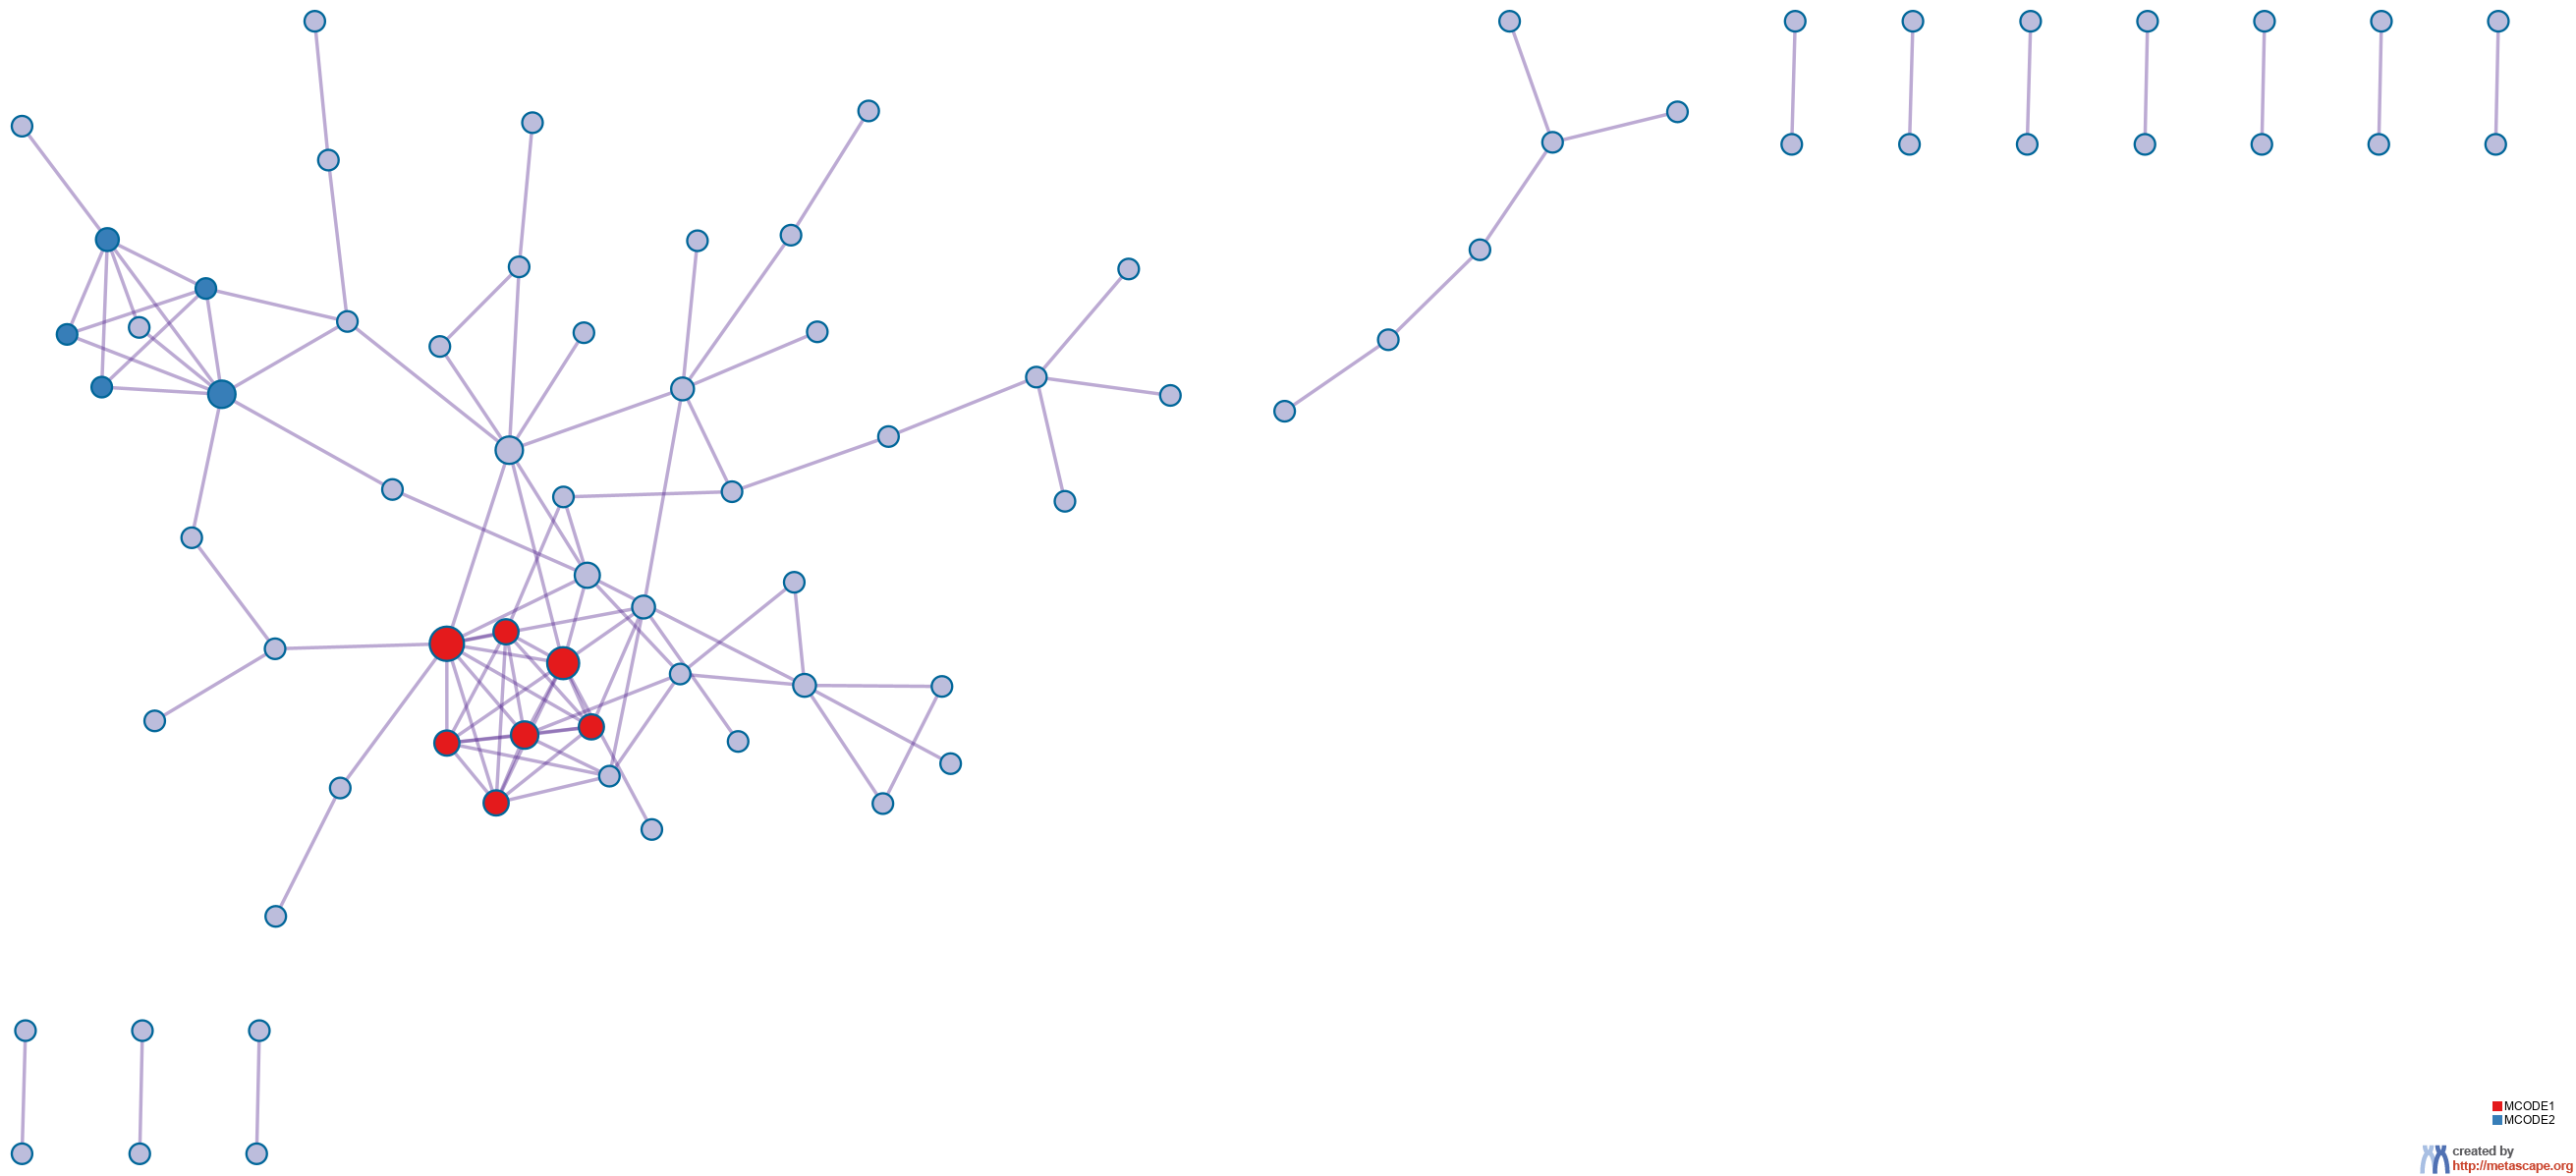
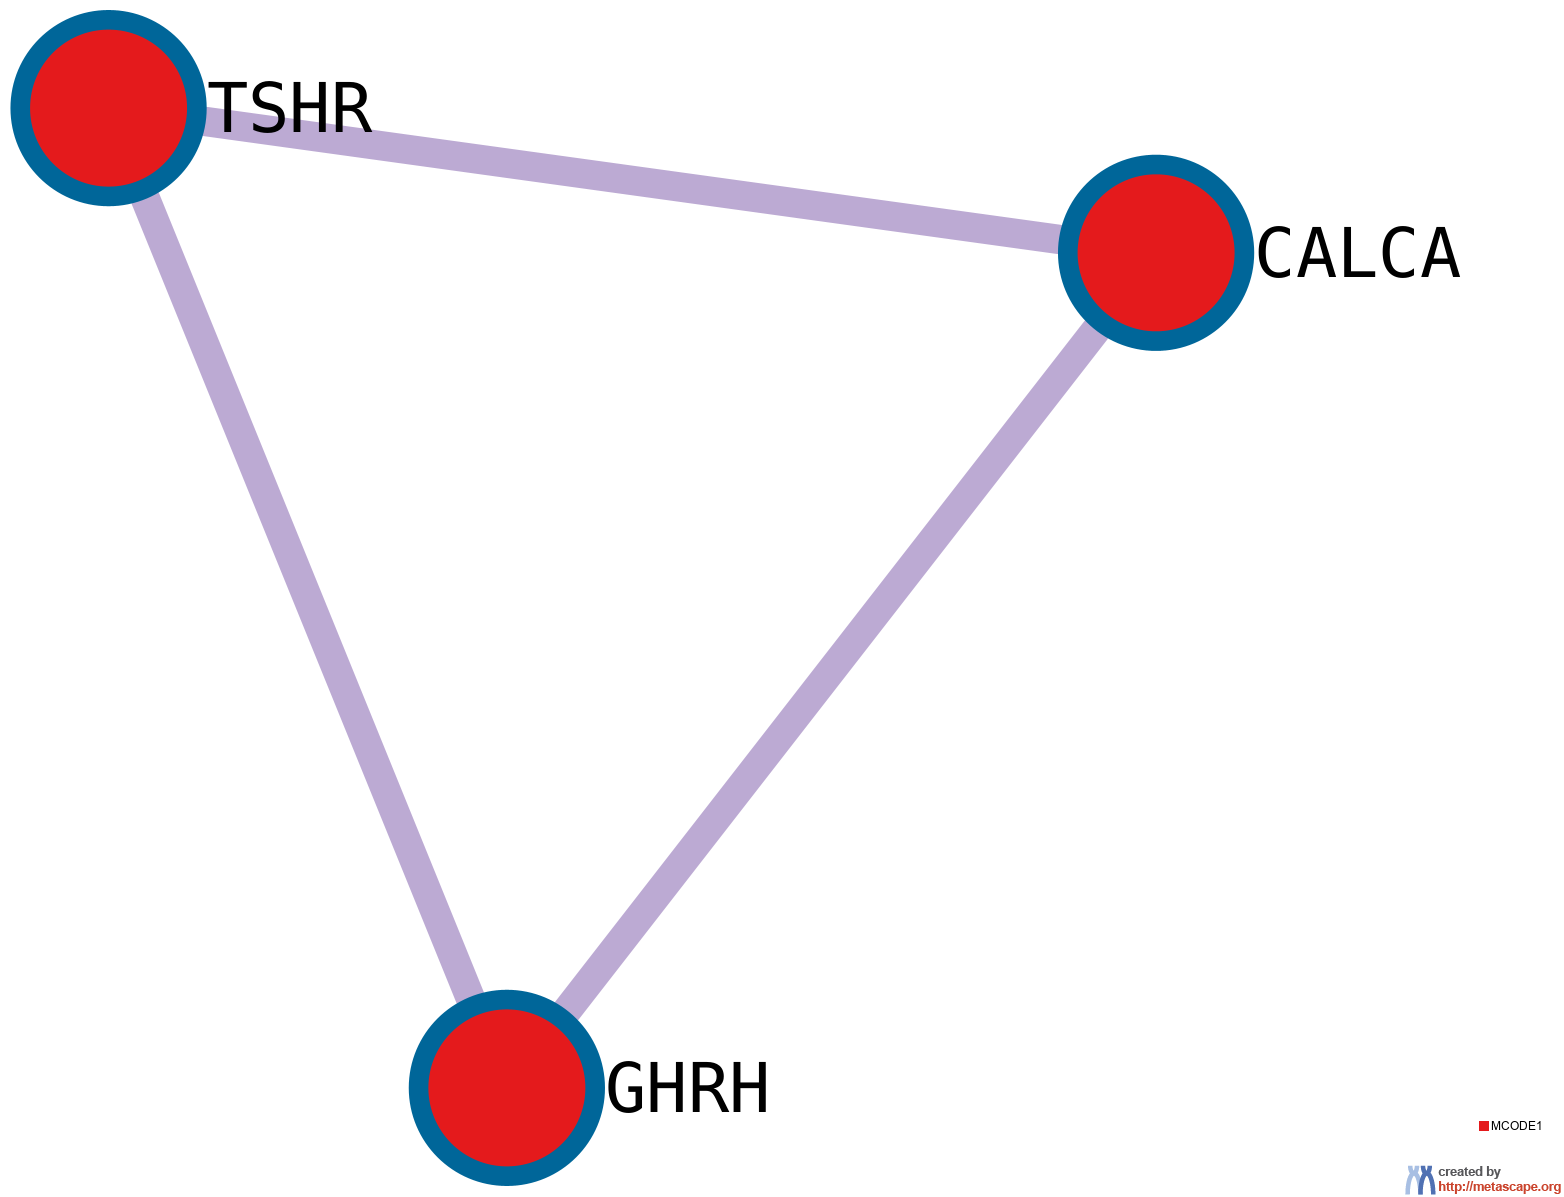
details). The resultant network contains the subset of proteins that form physical interactions with at least one other member in the list. If the network contains between 3 and 500 proteins, the Molecular Complex Detection (MCODE) algorithm
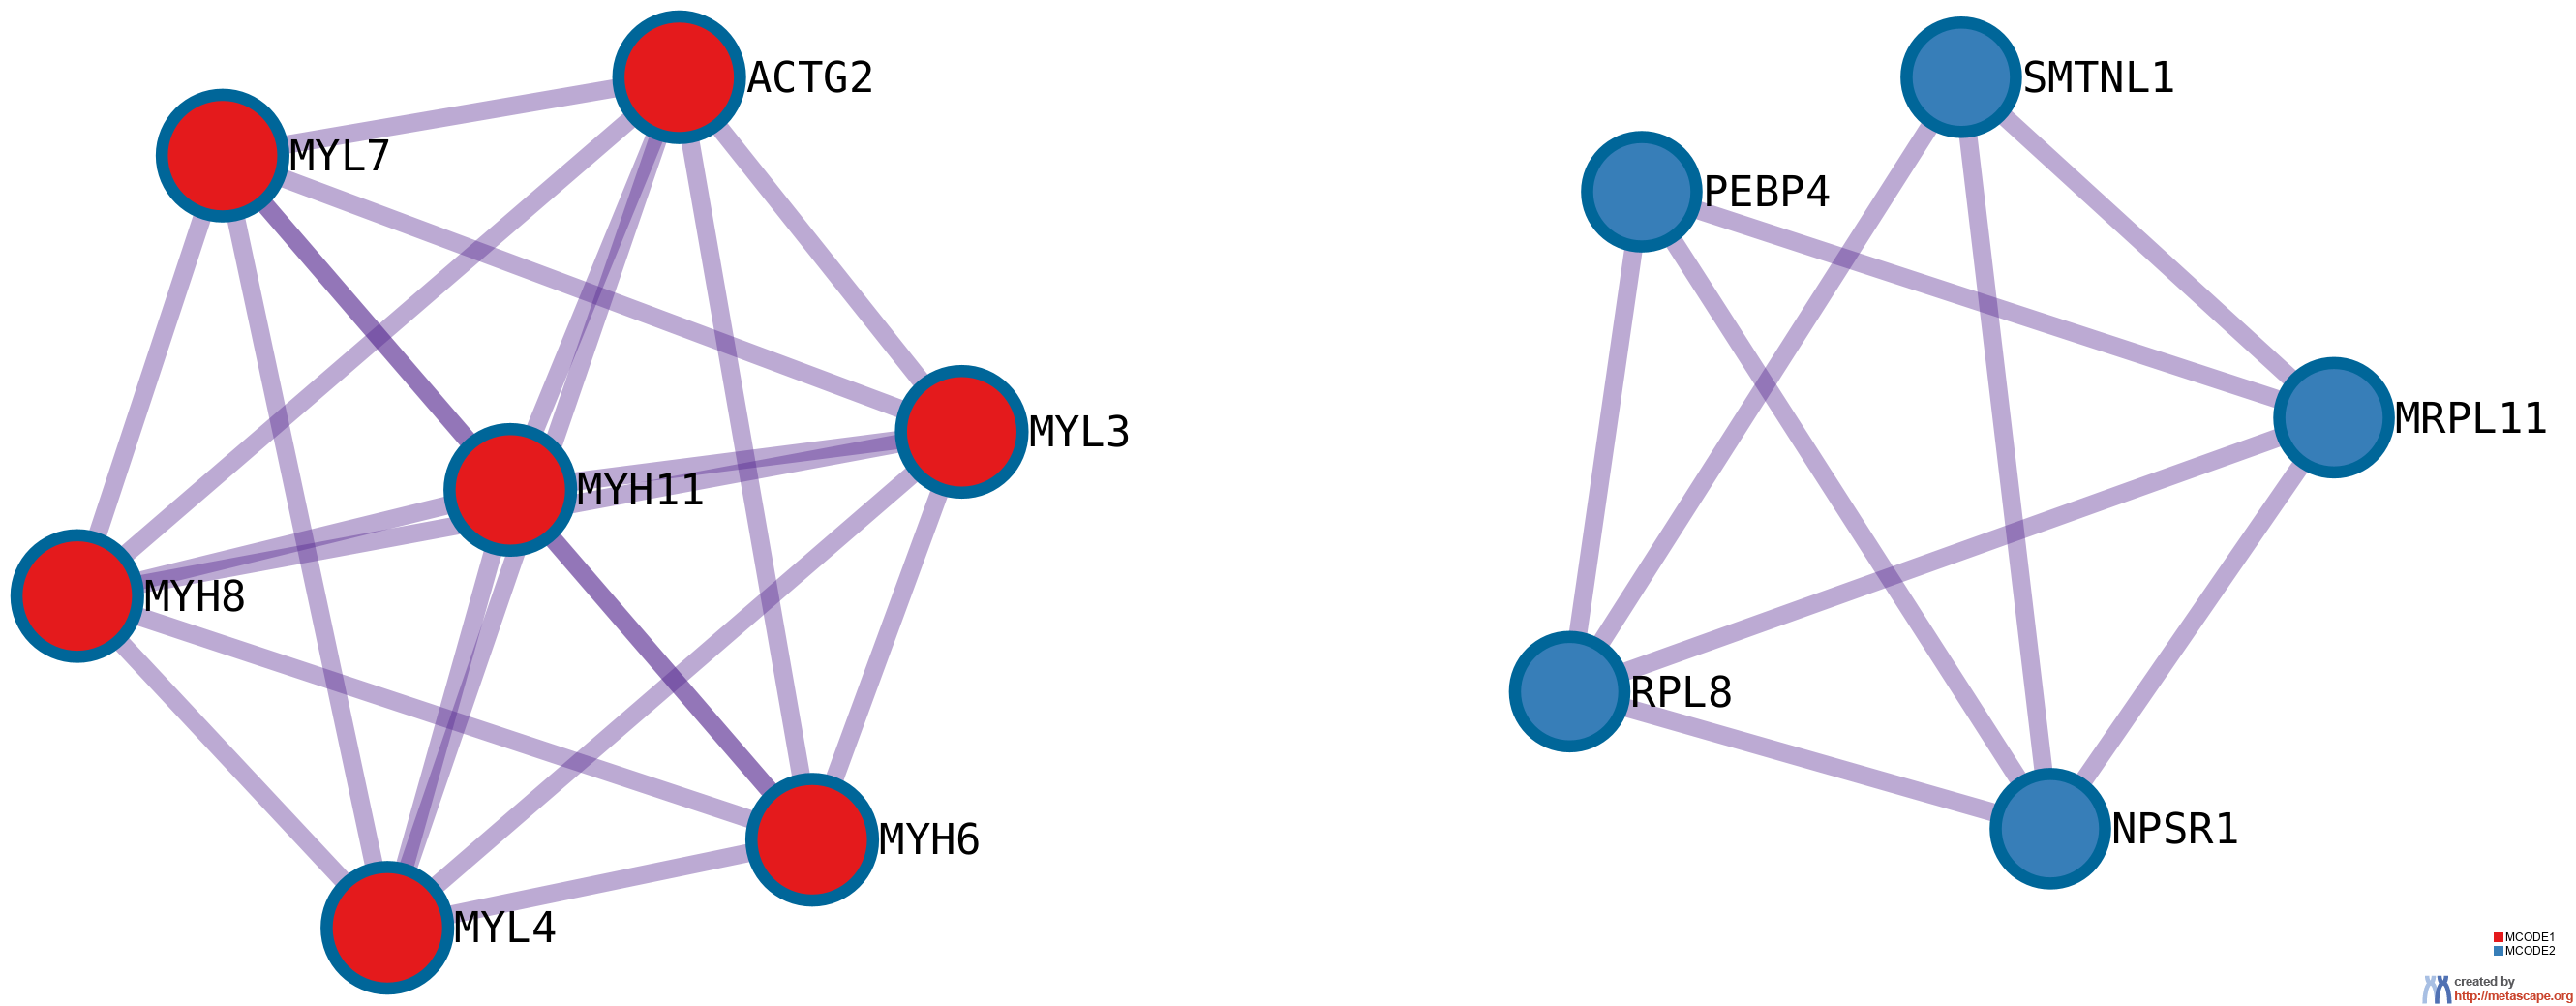
11 has been applied to identify densely connected network components. The MCODE networks identified for individual gene lists have been gathered and are shown in Figure 4.
Pathway and process enrichment analysis has been applied to each MCODE component independently, and the three best-scoring terms by p-value have been retained as the functional description of the corresponding components, shown in the tables underneath corresponding network plots within Figure 4.
Figure 4. Protein-protein interaction network and MCODE components identified in the gene lists.
Reference
- Zhou et al., Metascape provides a biologist-oriented resource for the analysis of systems-level datasets. Nature Communications (2019) 10(1):1523.
- Saldanha AJ. Java Treeview - extensible visualization of microarray data. Bioinformatics (2004) 20:3246-3248
- Zar, J.H. Biostatistical Analysis 1999 4th edn., NJ Prentice Hall, pp. 523
- Hochberg Y., Benjamini Y. More powerful procedures for multiple significance testing. Statistics in Medicine (1990) 9:811-818.
- Cohen, J. A coefficient of agreement for nominal scales. Educ. Psychol. Meas. (1960) 20:27-46.
- Shannon P. et al., Cytoscape: a software environment for integrated models of biomolecular interaction networks. Genome Res (2003) 11:2498-2504.
- Szklarczyk D. et al. STRING v11: protein-protein association networks with increased coverage, supporting functional discovery in genome-wide experimental datasets. Nucleic Acids Res. (2019) 47:D607-613.
- Stark C. et al. BioGRID: a general repository for interaction datasets. Nucleic Acids Res. (2006) 34:D535-539.
- Turei D. et al. A scored human protein-protein interaction network to catalyze genomic interpretation. Nat. Methods. (2016) 13:966-967.
- Li T. et al. A scored human protein-protein interaction network to catalyze genomic interpretation. Nat. Methods. (2017) 14:61-64.
- Bader, G.D. et al. An automated method for finding molecular complexes in large protein interaction networks. BMC bioinformatics (2003) 4:2.